SINAD: Definition, Formula, and Measurement Guide
In this article, you will learn what SINAD measures and how it evaluates overall signal quality by accounting for both noise and distortion. You will see how the measurement process works, from applying a clean test tone to separating unwanted components and converting the results to decibels. You will also understand how SINAD differs from SNR, THD, and ENOB. In addition, the article outlines where SINAD is commonly used in communication, audio, and electronic systems.Catalog
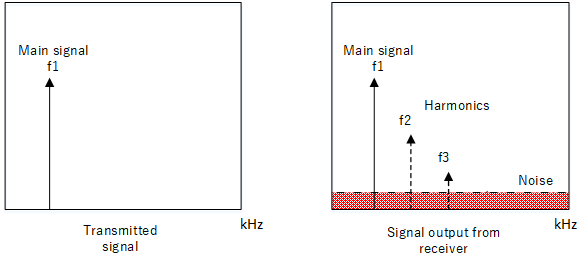
Figure 1. SINAD Signal Comparison Diagram
What is SINAD?
SINAD (Signal-to-Noise and Distortion ratio) measures the purity of a signal by comparing the desired output to the combined noise and distortion introduced by a device or receiver. As shown in the figure, a clean transmitted signal contains only the main tone, while the received output often includes harmonics and background noise that reduce overall signal clarity. Expressed in decibels (dB), SINAD provides a precise way to evaluate signal quality, receiver sensitivity, and the performance of communication and audio systems.
SINAD Measurement System Diagram
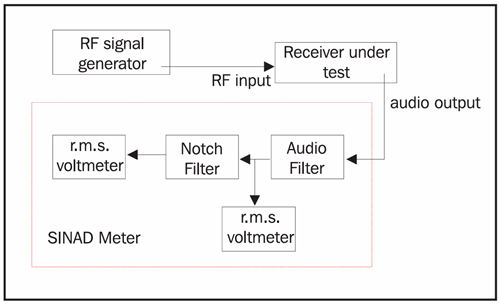
Figure 2. SINAD Measurement System Diagram
The diagram above illustrates a standard SINAD measurement setup, showing how each stage processes the signal during testing. A typical SINAD measurement setup includes:
• Signal generator – Produces a clean reference tone
• Device under test (DUT) – Commonly a radio receiver, amplifier, or ADC
• Bandpass or notch filter – Isolates or removes the frequency
• Audio analyzer / SINAD meter – Measures total noise and distortion
• Output monitoring – Verifies signal power during testing
The SINAD Formula
The standard equation for SINAD is:
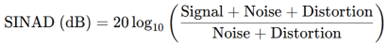
Where:
• Signal – Desired tone
• Noise – Background or thermal noise
• Distortion – Harmonics and nonlinearities
Some analyzers use a power-based form:
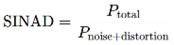
A high SINAD means noise and distortion represent only a small part of the total output, reflecting better system performance.
How SINAD Works?
SINAD works by measuring how much unwanted noise and distortion appear alongside a clean signal after it passes through a device or receiver. To start, a clean test tone is injected into the device under test (DUT), ensuring that any changes in the output come from the system itself. The analyzer then examines the output spectrum and identifies the signal, any harmonic distortion, and broadband noise introduced by the electronics.
Next, a notch filter or digital algorithm removes the tone, leaving only noise and distortion components behind. This filtered result shows how much the original signal has degraded as it moved through the system. Finally, the analyzer compares the remaining noise + distortion to the total output signal to calculate the SINAD value in decibels (dB).
Because SINAD accounts for both noise and all forms of distortion, it offers a realistic and comprehensive picture of true signal quality. This makes it valuable in evaluating receiver sensitivity, audio fidelity, and the dynamic performance of ADCs and other communication or signal-processing equipment.
How SINAD is Measured?
After understanding how SINAD works, the next step is to examine how SINAD is measured in practice. The figure below illustrates a typical SINAD measurement setup and shows how the signal moves through each stage of the equipment.
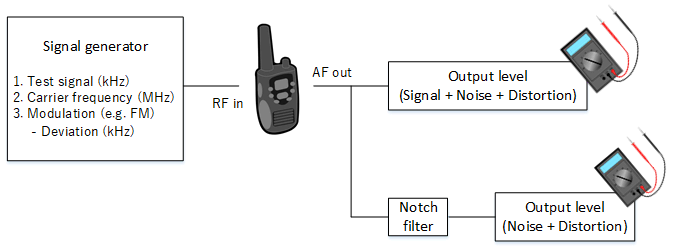
Figure 3. SINAD Measurement Block Diagram
Step 1: Apply a Known Test Tone
You begin the SINAD measurement by feeding a clean, known test signal from your signal generator into the receiver. This is usually a 1 kHz tone for audio testing or a modulated RF carrier for communication systems. By using a controlled input, you ensure that any noise or distortion you measure later comes from the device under test (DUT) and not from the source.
Step 2: Capture the Output Signal
Once the test signal passes through the receiver, you measure the full output, which includes the main signal, harmonic distortion, and any thermal or electrical noise added by the circuitry. This gives you a clear view of how the receiver alters the original tone and allows the SINAD meter to detect intermodulation and other unwanted components. In the diagram, this corresponds to the “Signal + Noise + Distortion” measurement path.
Step 3: Remove the Tone
To isolate noise and distortion, you route the output through a notch filter that removes the main test tone. The filter sharply suppresses the frequency while leaving unwanted components untouched. This gives you a clean measurement of only Noise + Distortion, as shown in the second path of the diagram.
Step 4: Compute the SINAD Ratio
With both measurements captured, you can now compare the Noise + Distortion level against the full output containing Signal + Noise + Distortion. This comparison shows how much of the receiver’s output is clean, usable signal versus unwanted artifacts. If noise and distortion are high, the SINAD value drops, indicating lower signal quality.
Step 5: Convert the Result to Decibels
Finally, you convert the SINAD ratio into decibels (dB) to make it easier to compare performance across different systems. Using dB helps you quickly assess receiver sensitivity, audio clarity, and overall device performance. A higher SINAD value means your system is delivering better signal purity with lower distortion.
Problems Affecting SINAD
Several factors can reduce SINAD performance:
• Electrical noise (thermal noise, EMI, interference)
• Harmonic distortion from amplifiers or ADC nonlinearity
• Phase noise in RF oscillators
• Insufficient filtering in receivers
• Grounding and shielding issues
• Bandwidth limitations
• Impedance mismatch
SINAD vs SNR vs THD vs ENOB
SINAD, SNR, THD, and ENOB are related measurements, but each describes signal quality in a different way. Understanding their differences makes it easier to know which metric to use for testing or analysis. The table below summarizes how they compare.
|
Aspect |
SINAD |
SNR |
THD |
ENOB |
|
Definition |
Ratio
of signal to combined noise and distortion |
Ratio
of signal to noise only |
Ratio
of harmonics to fundamental |
Effective
resolution derived from SINAD |
|
Primary
Focus |
Total
dynamic performance |
Noise
purity |
Linearity
and harmonic distortion |
Realistic
bit performance |
|
Output
Unit |
dB |
dB |
dB
or % |
Bits |
|
Analysis
Bandwidth |
Entire
spectral content except DC |
Noise
band only |
Harmonic
frequencies |
Based
on SINAD bandwidth |
|
Noise
Inclusion |
Yes |
Yes |
No |
Indirect |
|
Distortion
Inclusion |
All
types |
None |
Harmonics |
Indirect |
|
Measurement
Method |
FFT
with noise + distortion extraction |
FFT
excluding harmonics |
FFT
measuring harmonic amplitudes |
Computed
using formula |
|
Required
Test Signal |
Pure
tone near full scale |
Same
tone as SINAD |
Pure
sine |
Follows
SINAD test |
|
Required
Instrumentation |
High-resolution
FFT analyzer |
Spectrum
analyzer or ADC FFT |
Harmonic
measurement setup |
Calculator
only |
|
Applications |
ADC/DAC
validation, RF receivers, audio |
Low-noise
amplifier testing, ADC noise floor |
Amplifier
linearity, audio purity |
Converter
selection and design budgeting |
Applications of SINAD
RF and Wireless Communication
SINAD is widely used in RF and wireless systems to evaluate how well a receiver can detect weak signals. It helps determine receiver sensitivity by showing how much noise and distortion are present after demodulation. This makes SINAD a key metric for assessing overall RF performance in environments.
ADC and DAC Characterization
Many use SINAD to check the linearity and accuracy of ADCs and DACs during testing. It shows how much noise and distortion affect the converter’s output. By analyzing SINAD, you can determine the device’s true usable resolution.
Audio Equipment Testing
SINAD measures the clarity and purity of audio signals in equipment such as amplifiers, mixers, and recording devices. It highlights unwanted distortion and background noise that affect sound quality. With this metric, you can verify that audio systems deliver clean and accurate output.
Electronic System Design
SINAD helps identify issues in filtering, grounding, and shielding within electronic circuits. By analyzing signal quality, it can optimize the layout and reduce unwanted interference. This ensures more stable and reliable system performance during operation.
Measurement Equipment Calibration
SINAD is used to confirm that analyzers, radios, and test instruments perform within their specified accuracy. It verifies that noise and distortion levels remain within acceptable limits. Regular calibration using SINAD ensures consistent and dependable measurement results.
Conclusion
SINAD serves as a comprehensive indicator of signal quality because it accounts for both noise and distortion in a single measurement. The detailed steps of the process show how a system modifies a clean input and how these changes affect performance. Its comparison with other metrics clarifies the specific value SINAD provides in evaluating dynamic behavior. The various applications demonstrate its importance in testing, calibration, and the design of reliable electronic systems.
About us
ALLELCO LIMITED
Read more
Quick inquiry
Please send an inquiry, we will respond immediately.
Frequently Asked Questions [FAQ]
1. Can SINAD help identify issues in my existing electronic system?
Yes. A sudden drop in SINAD usually indicates problems such as interference, grounding issues, faulty filters, or component degradation. Monitoring SINAD helps detect faults early before they affect system performance.
2. What equipment upgrades can improve SINAD in my testing setup?
Using a low-noise signal generator, higher-resolution analyzers, quality notch filters, and properly shielded cables can significantly improve SINAD measurements. Each reduces unwanted interference that may degrade results.
3. What is considered a good SINAD value for high-quality equipment?
A SINAD value above 40–50 dB is generally considered acceptable for communication systems, while audio and precision measurement equipment often aim for 80 dB or higher. The higher the SINAD, the cleaner and more accurate the output signal.
4. How does SINAD affect the performance of ADC evaluation tools?
SINAD directly reflects the usable resolution of an ADC. Tools with higher SINAD ratings can more accurately assess converter performance, making them preferable for those validating precision electronics.
5. Can poor grounding or cabling lower my SINAD readings?
Yes. Improper grounding, loose connections, or unshielded cables can introduce additional noise and distortion, lowering SINAD accuracy. Ensuring clean wiring practices can improve measurement consistency.
MBRS340T3G Comprehensive Guide: Specifications, Applications and Installation Tips
on August 27th
Non-Sinusoidal Waveforms: Square, Rectangular and Pulsed Waveforms
on August 27th
Popular Posts
-

Complex Instruction Set Computers: How They Changed Computing?
on April 18th 147749
-

USB-C Pinout and Features
on April 18th 111904
-
Using Xilinx Unified Simulation Primitives: A Comprehensive Guide to FPGA Design and Simulation
on April 18th 111349
-

Power Supply Voltages in Electronics: Meaning of VCC, VDD, VEE, VSS, and GND
on April 18th 83714
-

RJ45 Connector Guide: Pinout, Wiring, Cable Types, and Uses
on January 1th 79502
-

The Ultimate Guide to Wire Color Codes in Modern Electrical Systems
The way our electrical systems use colors isn’t just for looks. Each wire color now indicates a specific function, making it easier to identify and handle electrical components correctly during ins...on January 1th 66868
-

Quality (Q) Factor: Equations and Applications
The quality factor, or 'Q', is important when checking how well inductors and resonators work in electronic systems that use radio frequencies (RF). 'Q' measures how well a circuit minimizes energy...on January 1th 63004
-
Purge Valve Guide: Function, Symptoms, Testing, and Replacement for Optimal Engine Performance
The purge valve is a key part of a car’s system that helps keep the air clean by managing fuel vapors before they can escape into the atmosphere. This not only helps the environment by reducing pol...on January 1th 62937
-

Achieving Peak Performance with the Maximum Power Transfer Theorem
The Maximum Power Transfer Theorem explains how energy from a source, such as a battery or generator, flows to a connected load. It shows the exact condition where the load receives the most power....on January 1th 54076
-

A23 Battery Specifications and Compatibility
The A23 battery is a small, cylinder-shaped battery with high voltage. Also called 23A, 23AE, or MN21, it runs at 12 volts and much higher than AA or AAA batteries. Its special design make...on January 1th 52087
HOT Part Number
-
LTC4063EDD#TRPBF
Analog Devices Inc.
IC BATT CHG LI-ION 1CELL 10DFN
MIMX8MM1CVTKZAA
NXP USA Inc.
IC MPU I.MX 8M MINI SOLOLITE
APDS-9005-020
Broadcom Limited
SENSOR OPT 500NM AMB 6CHIPLED
06031A820KAT2A
KYOCERA AVX
CAP CER 82PF 100V C0G/NP0 0603
ICM-20602
TDK InvenSense
IMU ACCEL/GYRO/TEMP I2C/SPI LGA
170M4611
Eaton - Bussmann Electrical Division
FUSE SQUARE 350A 700VAC RECT
08053C105JAZ2A
KYOCERA AVX
CAP CER 1UF 25V X7R 0805
EP1C12F324C6N
Intel
IC FPGA 249 I/O 324FBGA
2SC4617T1G
onsemi
TRANS NPN 50V 0.1A SC75 SOT416
TL431AILPRAG
onsemi
IC VREF SHUNT ADJ 1% TO92-3
ADAU1787BCBZRL
Analog Devices Inc.
4 ADC, 2 DAC LOW POWER CODEC, AU
74VHC164MTCX
onsemi
IC SHIFT REGISTER 8BIT 14TSSOP
DAN222M3T5G
onsemi
DIODE ARRAY GP 80V 100MA SOT723
NR3015T470M
Taiyo Yuden
FIXED IND 47UH 300MA 1.608OHM SM
MM3Z18VC
onsemi
DIODE ZENER 18V 200MW SOD323F
1N4001W
Rectron USA
DIODE GEN 1A 50V SOD-123F
SMBJ90A
Taiwan Semiconductor Corporation
TVS DIODE 90VWM 146VC DO214AA
NTA1215MC
Murata Power Solutions Inc.
DC DC CONVERTER +/-15V 1W -
SDR1307-101KL
Bourns Inc.
FIXED IND 100UH 1.9A 180MOHM SMD
AOT5B65M1
Alpha & Omega Semiconductor Inc.
IGBT 650V 5A TO220
STP16CP596B1R
STMicroelectronics
IC LED DRIVER LINEAR 50MA 24DIP
AD7895ANZ-2
Analog Devices Inc.
IC ADC 12BIT SAR 8DIP
MURB1620CTT4G
onsemi
DIODE ARRAY GP 200V 8A D2PAK
STGIPS30C60T-H
STMicroelectronics
MOD IPM SLLIMM 30A 600V 25SDIP
IXDN604SIA
IXYS Integrated Circuits Division
IC GATE DRVR LOW-SIDE 8SOIC
CY7C63743-SC
Infineon Technologies
IC MCU 8K LS USB/PS-2 24-SOIC
U2745B-MFBG3
Microchip Technology
RF TX IC UHF 310-440MHZ 16LSSOP
DSPIC30F4013T-30I/PT
Microchip Technology
IC MCU 16BIT 48KB FLASH 44TQFP
ADF4106BRUZ-RL
Analog Devices Inc.
IC CLK/FREQ SYNTH 16TSSOP
EL8403IS
Elantec
IC OPAMP GP 4 CIRCUIT 14SOIC
8A35001B-001AJG
Renesas Electronics America Inc
NETWORK TIMING
GRM0337U1HR90BD01D
Murata Electronics
CAP CER 0.9PF 50V U2J 0201
LT1356CS#PBF
Analog Devices Inc.
IC VOLTAGE FEEDBACK 2 CIRC 16SO
AON7280
Alpha & Omega Semiconductor Inc.
MOSFET N-CH 80V 20A/50A 8DFN
IRLI540N
Infineon Technologies
MOSFET N-CH 100V 23A TO220AB FP
VI-J6Z-MZ
Vicor Corporation
VI-J6Z-MZ 300V 2V 5A -
LMH6722MA
Texas Instruments
IC AMP CURRENT FEEDBACK 14SOIC
HZM6.8Z4MWATL-E
Renesas Electronics America Inc
TVS DIODE 3.5VWM 3MPAK
LM4041DIM7-1.2
Texas Instruments
IC VREF SHUNT 1% SC70-5
RT6200GE
Richtek USA Inc.
IC REG BUCK ADJ 600MA SOT23-6
R5F21274SNFP#X6
Renesas Electronics America Inc
IC MCU 16BIT 16KB FLASH 32LQFP
1N5227B
onsemi
DIODE ZENER 3.6V 500MW DO35
12102C472JAT2A
KYOCERA AVX
CAP CER 4700PF 200V X7R 1210
PZTA64
Fairchild Semiconductor
SMALL SIGNAL BIPOLAR TRANSISTOR,
XC1765ELSO8C
AMD
IC PROM SER C-TEMP 3.3V 8-SOIC
XR88C92CJ-F
MaxLinear, Inc.
IC UART FIFO DUAL 44PLCC
RT24C2X202
Bourns, Inc.
TRIMMER 2K OHM 0.75W PC PIN SIDE
DLW31SN900SQ2L
Murata Electronics
CMC 370MA 2LN 90 OHM SMD
LMK432F476ZM-T
Taiyo Yuden
CAP CER 47UF 10V Y5V 1812
MOC207R1VM
onsemi
OPTOISO 2.5KV TRANS W/BASE 8SOIC
GRM0335C1E390JD01D
Murata Electronics
CAP CER 39PF 25V C0G/NP0 0201
SE10PG-M3/84A
Vishay General Semiconductor - Diodes Division
DIODE GEN PURP 400V 1A DO220AA
RABS15M REG
Taiwan Semiconductor Corporation
BRIDGE RECT 1P 1KV 1.5A ABS-L
PI74LPT16245AEX
Diodes Incorporated
IC TXRX NON-INVERT 3.6V 48TSSOP